Yesterday Scott Hanselman blogged about an analysis tool called ‘Ohloh‘. I checked out what it had to say about BOINC.
Direct project url:
http://www.ohloh.com/projects/3215
It generates many charts and graphics about the changes it detects in the source tree over time. I have looked over quite a few things and got to heckle David a bit about some of the graphs. I really got a kick out of this chart:
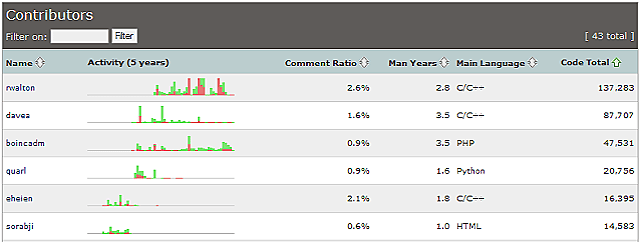
To be fair though I need to point out that David checks in code using ‘davea’, ‘boincadm’, and ‘sorabji’ depending on where or when he has checked in code.
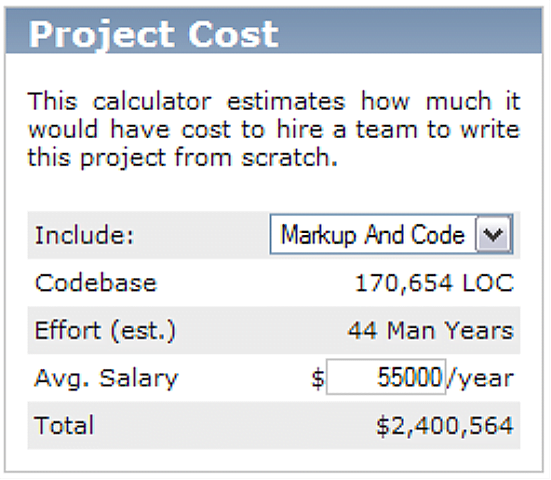
This is one chart we both got a kick out of:
How cool is that?
—– Rom
This post was last modified on December 17, 2020 3:55 pm
2020 turns out to be a hardware refresh year for ROMWNET. I've upgraded the network…
After a bit of research and experimentation, I figured out how to fix my permalink…
After a seriously long time, I've finally upgraded my blogging platform to WordPress. Dasblog was…
Original post: New BOINC Manager Design Project: BOINC Sentinels Some time back, I started BOINC…
So I have been working on a little side project on and off for a…
Well I believe I have found and fixed the screen saver issue that has been…
This website uses cookies.